
I can help you develop your sales dashboard using Google Data Studio/ Looker Studio
- 4.3
- (5)
Project Details
Why Hire Me?
I have 7+ years of experience in building interactive dashboards tailored for sales monitoring, combining data visualization expertise with a deep understanding of business KPIs. My dashboards not only display metrics but provide decision-ready insights.
Why Clients Choose Me:
-
Expert in Google Data Studio and Looker Studio with real-time dashboard solutions
-
Skilled at connecting diverse data sources (e.g., Excel, BigQuery, Google Sheets, CRMs)
-
Designs include drill-down filters, comparative views, and intuitive layouts
-
Experience in retail, SaaS, B2B, and e-commerce sales data
-
Supports KPI alignment, performance tracking, and team training
-
Delivery includes maintenance-ready templates and clear documentation
What I Need to Start Your Work
Please provide the following to ensure an efficient dashboard setup:
1) Project Overview and Dashboard Objectives
-
Purpose of the dashboard (e.g., sales team tracking, regional sales comparison, product category insights)
-
Key KPIs to be tracked (e.g., revenue, conversion rate, average order value)
2) Data Source and Integration Requirements
-
Type and source of sales data (e.g., Google Sheets, CRM, POS, SQL databases)
-
Frequency of data refresh (real-time, daily sync, manual upload)
-
Details on login credentials, API keys, or access permissions
3) Dashboard Design and Features
-
Preferred layout or sample references (if any)
-
Visual elements needed: bar charts, line graphs, pie charts, tables, heat maps
-
Filters or segments: by region, product, time, team, etc.
4) Reporting and Insights Focus
-
Specific sales patterns to highlight: trends, dips, peaks, YoY comparisons
-
Desired granularity: daily, weekly, monthly, quarterly views
-
Any alert thresholds or performance benchmarks to include
5) Access and Sharing Preferences
-
Who needs access (email IDs, roles)
-
Permission levels: viewer, editor, admin
-
Export requirements: PDF, CSV, scheduled email reports
6) Compliance and Data Security
-
Any legal compliance to consider (e.g., GDPR, internal IT policies)
-
Preferred method for secure file sharing and data handling
7) Project Timeline and Milestones
-
Final delivery deadline
-
Prototype/demo review checkpoints
-
Time for final revisions and QA testing
8) Communication and Collaboration
-
Preferred channel (e.g., WhatsApp, Slack, Email)
-
Frequency of check-ins (daily, bi-weekly, milestone-based)
9) Additional Requirements or Customizations
-
Custom color themes, logo placement, white-labeling
-
Integration with other dashboards or platforms
-
Any future scalability considerations (e.g., for adding more data sources)
Portfolio
Multi-Region Sales Dashboard in Google Data Studio
Explore how a retail chain used Google Data Studio to build a real-time sales dashboard tracking regional performance, sales reps, and product KPIs. A case study in sales data visualization and decision-making efficiency.
SaaS Sales Funnel Dashboard in Looker Studio
See how a SaaS company used Looker Studio to visualize its lead-to-conversion funnel by integrating Google Analytics, HubSpot, and Stripe. A case study in aligning sales, marketing, and revenue insights through data.
Product-Level Sales and Inventory Dashboard for E-Commerce
Learn how a D2C brand used Google Data Studio to track SKU-level sales, profit margins, and stock levels. A case study in e-commerce dashboard design for data-driven inventory and pricing decisions.
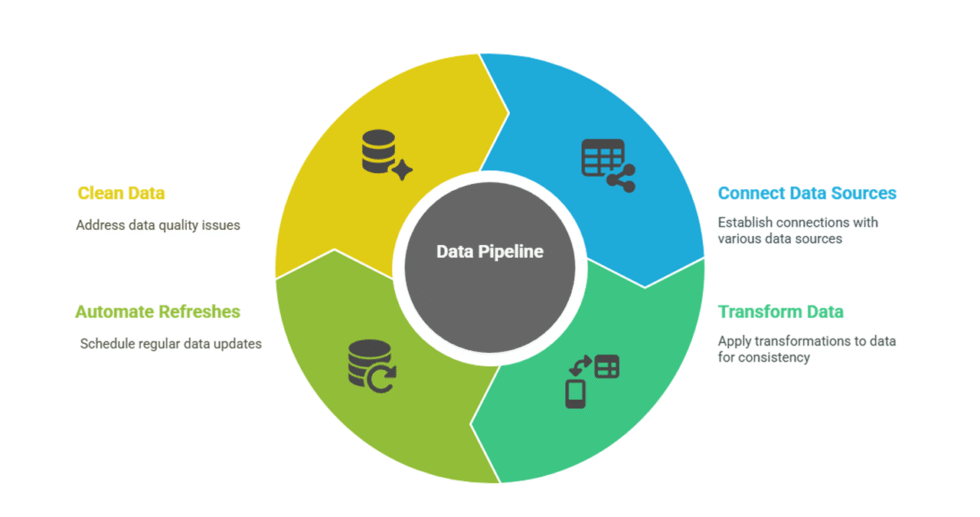
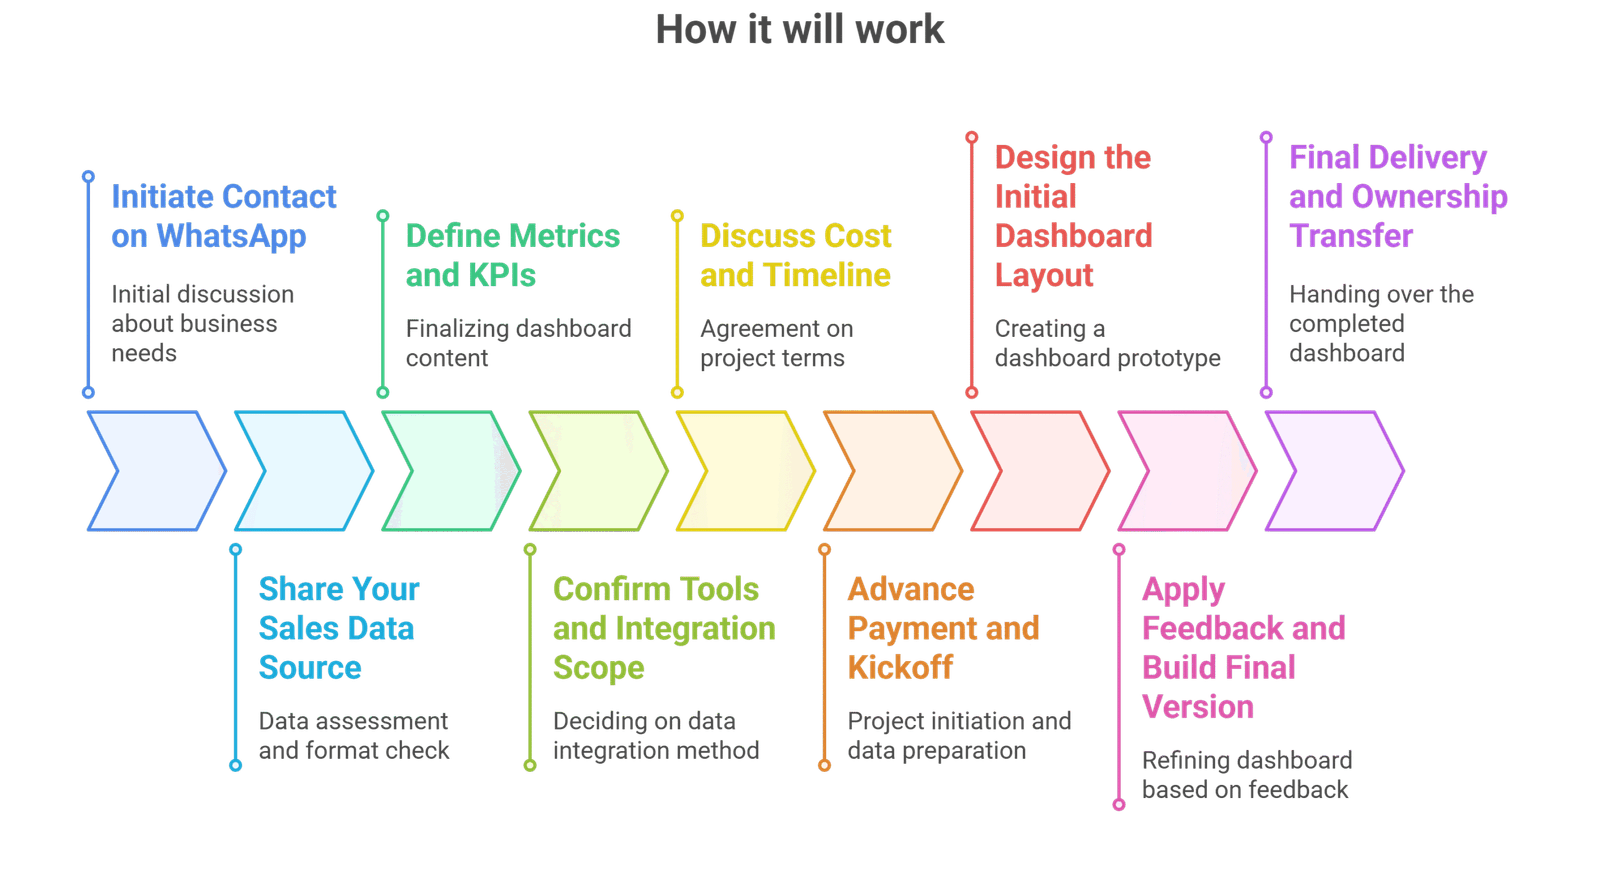
Process
Customer Reviews
5 reviews for this Gig ★★★★☆ 4.3
We had a CRM, Google Sheets, and Shopify and somehow, he linked all of them into one live dashboard. Seeing everything from daily revenue to abandoned cart trends in one screen changed how we operate. He was patient with all our change requests and got it done professionally.
Before this, my sales reports were static PDFs that I barely read. Now, I can explore data live and answer investor questions in meetings just by opening the dashboard. However, I’d suggest he adds a short video guide to help teams onboard faster.
I run a mid-sized ecommerce store and was totally blind to monthly trends. The Google Data Studio dashboard he created made my entire sales funnel transparent in one page. I especially liked how I could click and drill into specific weeks or campaigns.
The dashboard helped us realize our top-selling product had been dipping for three months straight without us noticing. His layout is simple and elegant, but a few custom metric calculations took longer than expected. Still, it was worth the wait for what we got.
We had raw sales data scattered across sheets and systems, but he pulled it all into a clean, interactive dashboard in Looker Studio. Our team now checks real-time KPIs daily without needing to ask the data team. The filters by region and product line were exactly what we needed.
Quick View
Starts at $55
Basic dashboard, limited filters
-
 3
Days Delivery
3
Days Delivery
-
 1
Revision
1
Revision
Growth Monitor
Starts at $95
Interactive insights with drilldowns
-
5
Days Delivery
-
3
Revisions
Pro Dashboard
Starts at $250
Advanced analytics with full access
-
12
Days Delivery
-
Unlimited
Revisions


