
I can help you develop your sales dashboard using Power BI
- 4.3
- (5)

Project Details
Why Hire Me?
With over 7 years of experience in data analysis and business intelligence, I bring the technical skill and domain understanding needed to convert your raw sales data into strategic insights using Power BI.
Why Clients Choose Me:
-
Proficient in data modeling, DAX measures, and Power Query
-
Skilled in multi-source data integration (Excel, SQL, CRM, APIs, etc.)
-
Able to design industry-specific dashboards tailored to your KPIs
-
Experienced in building scalable, user-friendly interfaces
-
Expertise across sectors: eCommerce, SaaS, retail, B2B services
-
Provide training, documentation, and post-deployment support
What I Need to Start Your Work
Please share the following inputs to ensure a smooth project kickoff:
1) Project Description and Dashboard Goals
-
Clear statement of what the dashboard should help achieve
-
List of KPIs or metrics to visualize (e.g., sales volume, conversion rate)
2) Data Integration and Sources
-
All relevant datasets (Excel, CSV, or DB connection details)
-
Information on frequency of data updates (manual, API, live sync)
-
Details of any preprocessing already completed or required
3) Dashboard Design and Functionalities
-
Preferred visual style (minimalist, business, executive view, etc.)
-
List of required visualizations: charts, tables, KPIs, maps
-
Filters or segmentation: product, region, time period, etc.
4) Analytics and Reporting Features
-
Type of analytics (trend analysis, YoY, MoM, cohort analysis)
-
Update frequency and required automation for data refresh
-
Expected depth of insights (summary vs detailed breakdowns)
5) User Access and Distribution
-
List of users and roles with view/edit permissions
-
Preferred sharing method: Power BI Service, PDF export, PPT embedding
6) Compliance and Security Standards
-
Any internal or external data security protocols (e.g., ISO, GDPR)
-
Preferred method for sharing sensitive data and credentials
7) Project Timeline and Deliverables
-
Final deadline
-
Intermediate delivery dates for wireframes, feedback, and revisions
8) Communication and Feedback Process
-
Preferred tools: WhatsApp, Slack, Zoom, Email
-
Frequency of updates and checkpoints
9) Additional Customization and Requirements
-
Advanced DAX logic or calculated columns/measures
-
Drill-throughs, bookmarks, dynamic titles, etc.
-
Any integration with external apps (like MS Teams, Outlook, SharePoint)
Portfolio
Power BI Sales Dashboard for Regional Performance and Target Tracking
Learn how an FMCG brand used Power BI to track regional sales, monitor target achievement, and identify underperforming zones. A case study in real-time sales analytics and KPI visualization for distributed teams.
Power BI Dashboard for B2B Customer Segmentation and Profitability
See how a B2B manufacturer used Power BI to segment customers by value and analyze profitability using RFM and margin data. A case study in sales optimization and customer retention strategy.
Power BI Dashboard for E-commerce Campaign and Product Performance
Explore how an e-commerce brand used Power BI to connect ad spend with product sales, optimize ROAS, and guide campaign strategy. A case study in integrating Google Ads, Facebook Ads, and Shopify data for actionable insights.
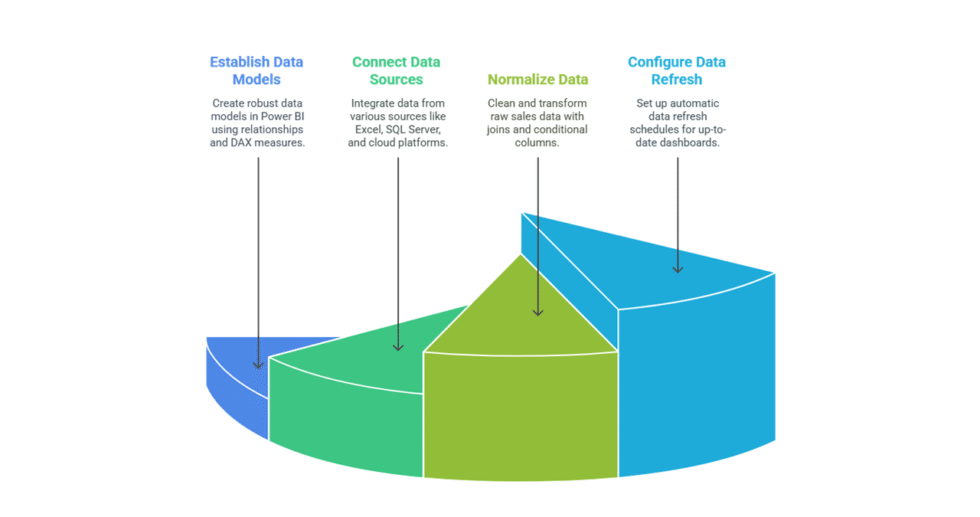
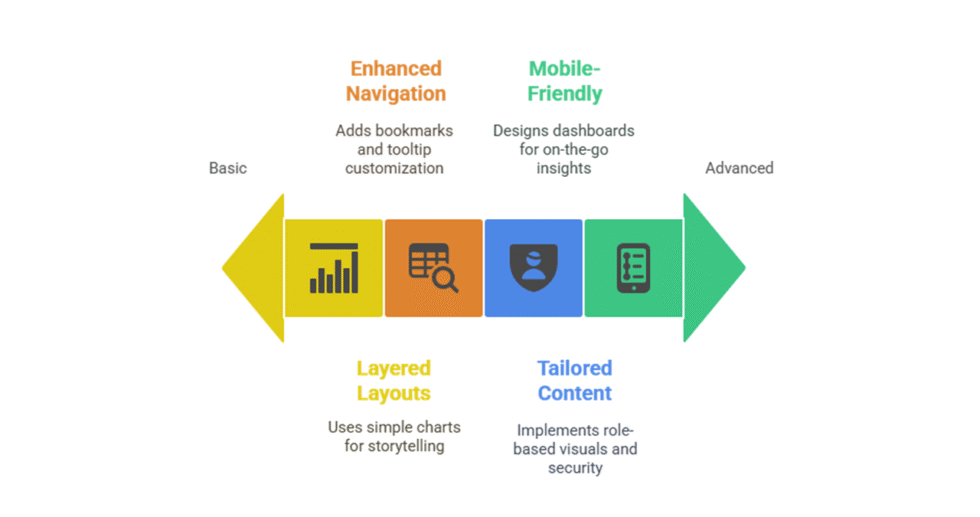
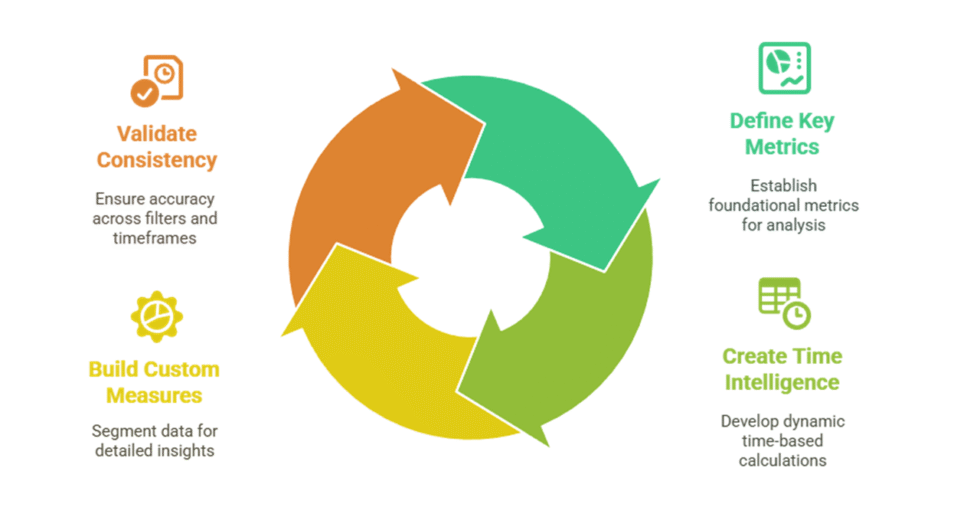
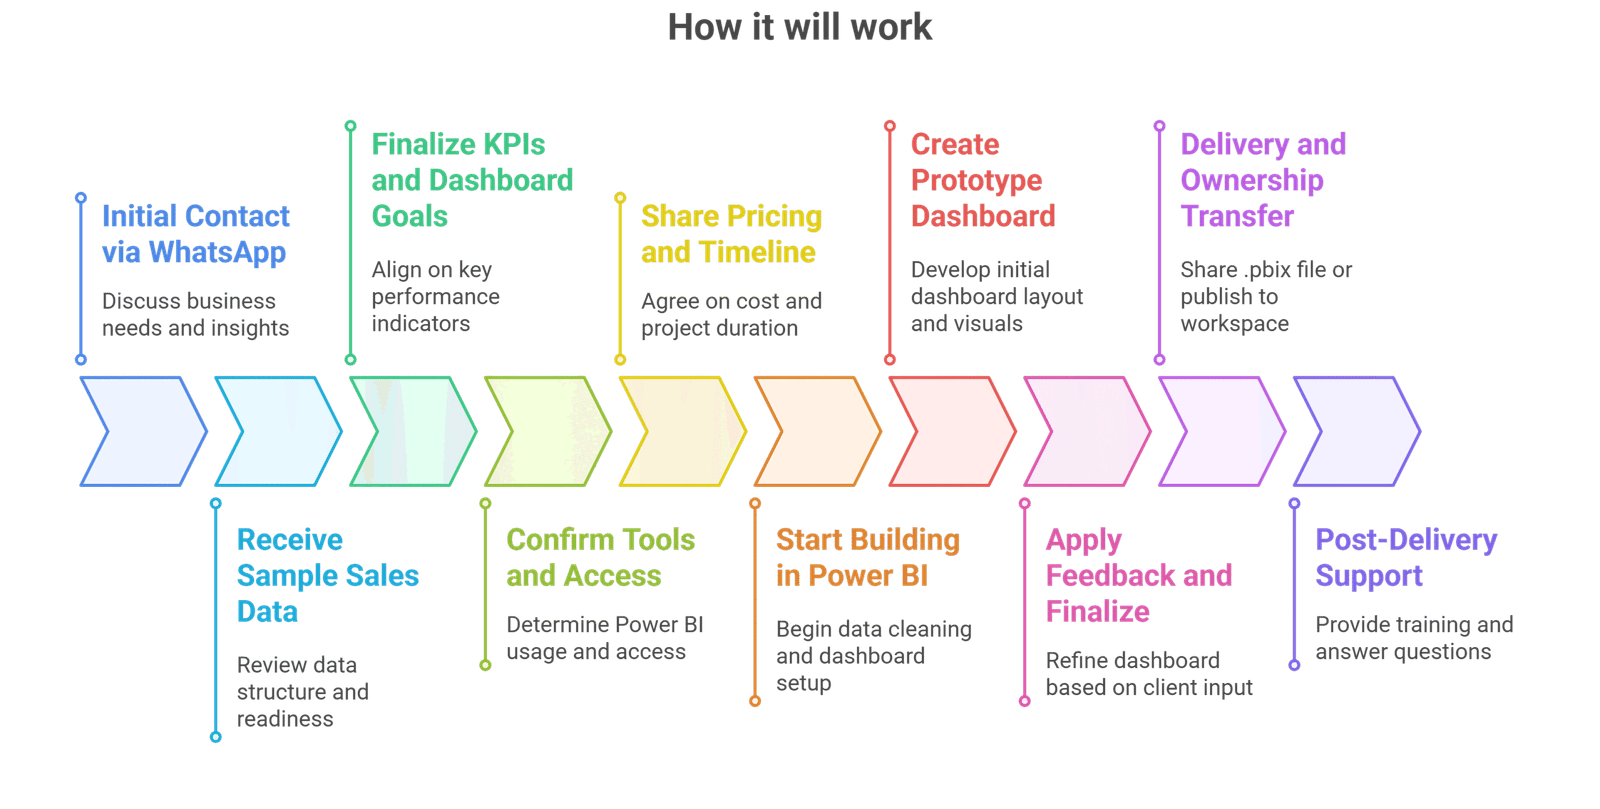
Process
Customer Reviews
5 reviews for this Gig ★★★★☆ 4.3
Very helpful in setting up a daily auto-refresh sales dashboard that saved hours of manual work.
The report worked well overall, but the integration with our CRM data took a bit longer than expected.
Our management team finally understood the data thanks to the well-structured Power BI visuals.
Great visuals and layout, though I had to ask for one more slicer to match our product categories.
The dashboard was clean, responsive, and made it easy to track our weekly sales trends with just one click.
PowerLite View
Starts at $55
Simple dashboard with static KPIs
-
 3
Days Delivery
3
Days Delivery
-
 1
Revision
1
Revision
Sales Performance Pro
Starts at $150
Interactive dashboard with filters & KPIs
-
5
Days Delivery
-
3
Revisions
Executive BI Suite
Starts at $299
Fully customized, end-to-end sales dashboard
-
12
Days Delivery
-
Unlimited
Revisions


